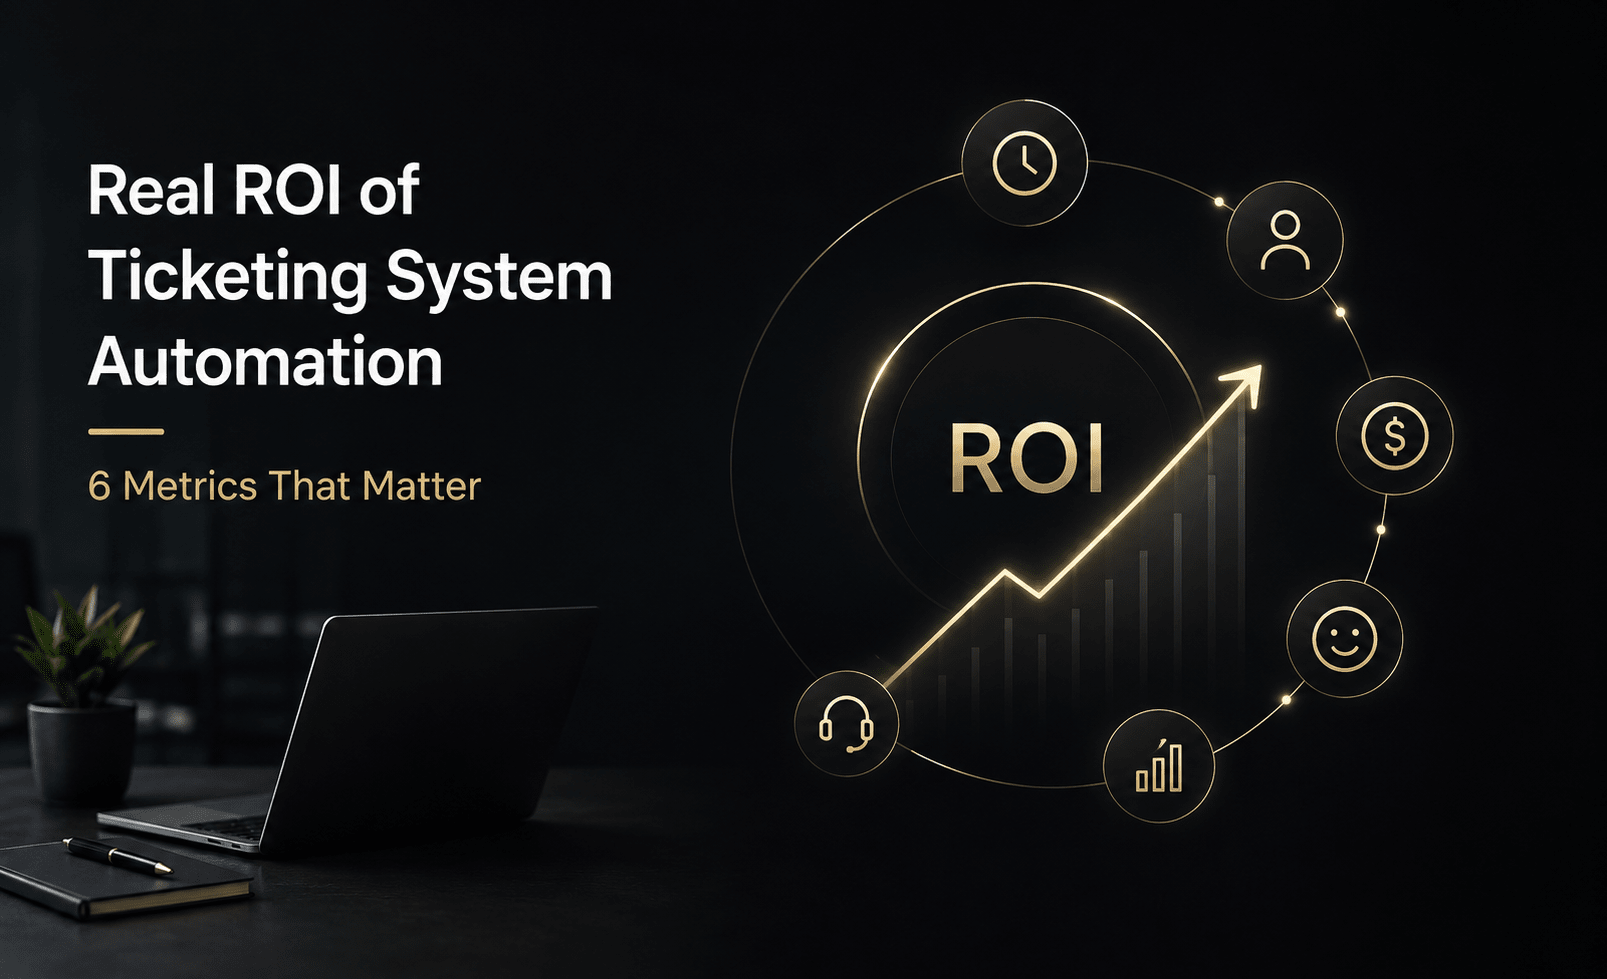
Most ROI calculations for ticketing system automation that Indian companies see during vendor evaluations focus on a single metric - ticket volume reduction. The vendor projects that automation reduces ticket volume by X%, saves Y agent hours, and produces Z lakh in monthly cost reduction. Show that, declare ROI.
This framing is misleading in two specific ways. Volume reduction can come from causes other than improvement (customers giving up on the channel, for example). And volume reduction without resolution time, SLA, and CSAT improvement may not actually mean the operation is better - it may just mean fewer customers are being served.
The full ROI picture requires six metrics, used together.
Metric 1 - Auto-resolution rate
Share of inbound tickets resolved by AI without human escalation. The primary input metric. Mature ticketing automation deployments achieve 30% to 50% in most Indian service operations contexts.
Tracking discipline. Measure tickets actually closed by AI, not tickets that started in AI and escalated. Escalations are appropriate and should be counted separately. The deflection rate - tickets handled fully by AI - is the core metric.
Metric 2 - Average resolution time (TAT)
End-to-end time from ticket creation to closure. The composite metric that captures both auto-resolution speed and human-handling speed.
Indian baselines vary widely. SaaS customer support typically 8-24 hours. IT helpdesk 4-12 hours. Enterprise B2B support 24-72 hours. Insurance claims 48-168 hours. The starting baseline matters less than the trajectory - good ticketing automation compresses TAT by 30-50% over 12 months in most contexts.
Composition matters. Blended TAT improves partly because AI-handled tickets close in minutes (versus hours for human-handled), pulling the average down. The blended improvement is real and shows up in cost. The TAT on human-handled tickets - which should also improve from AI-assisted resolution - is the signal that the automation is making humans more effective.
Metric 3 - First contact resolution (FCR)
Share of tickets resolved in the first interaction without reopening. The metric that measures resolution quality.
Indian baselines often sit at 60% to 75% in customer service operations. Good automation lifts this to 75% to 90% because AI-assisted resolution surfaces context that helps agents identify and solve the actual issue rather than producing band-aid fixes that bounce back.
FCR is the metric that distinguishes velocity improvement from quality improvement. Operations that improve TAT while FCR declines are speeding up bad resolutions. Operations that improve both are actually getting better at service.
Metric 4 - SLA compliance
Share of tickets resolved within the contractual or internal SLA window. The metric that ties operations to commitments.
Indian baselines for customer service operations often sit at 60-80% compliance. Mature automation pushes this to 85-95% through three mechanisms - deflection of easy tickets that no longer compete for capacity, faster human resolution through AI assist, and SLA-aware routing that prioritises near-breach tickets.
SLA compliance lift is often the most visible business impact of ticketing automation because it directly affects contract performance for B2B operations and customer experience commitments for B2C.
Metric 5 - Post-resolution CSAT
Customer satisfaction with the resolution, measured shortly after closure. The lagging quality metric.
Indian baselines vary widely by industry and company. The trend matters more than the absolute number. Good automation moves CSAT positive because customers get faster, more accurate resolutions. Bad automation moves it negative because customers experience AI loops, frustration, and resolutions that miss what they actually needed.
CSAT is the metric that surfaces whether the automation is delivering experience improvement or just operational efficiency. An operation with rising auto-resolution rate and falling CSAT is automating in the wrong direction.
Metric 6 - Recurring issue rate
Share of tickets that are repeats of issues seen in the prior 90 days. The metric that surfaces whether resolutions are sticking, whether knowledge is being captured, and whether root causes are being addressed.
Most Indian operations do not track this. The metric is hard to compute manually because it requires comparison across time periods and ticket content matching. Mature ticketing automation surfaces it as a built-in capability.
A high recurring issue rate is the silent symptom of ticketing-as-tracking. Tickets close, resolutions get logged, but the underlying issues recur because no one is connecting the dots. Good ticketing automation surfaces the recurrence pattern, feeds it back to the operations and product teams, and produces declining recurring issue rates over time as root causes get addressed.
Hidden costs the vendors do not mention
Three.
Implementation effort. Quoted license fees exclude integration cost. Real implementation includes ticketing platform integration (Freshdesk, Zendesk, ServiceNow, Jira SM, Zoho Desk - each has its own realities), CRM integration, knowledge base ingestion, intent flow design, vernacular configuration, sector-specific compliance setup, agent training, hand-off workflow design. For an Indian mid-sized operation handling 2,000-5,000 tickets per month, this is typically 200 to 400 hours of internal effort plus INR 5 to 15 lakh of consulting in the first 90 days.
Ongoing tuning. Auto-resolution flows need adjustment based on actual ticket data. New product launches create new ticket types. Edge cases that surface in production need handling. Plan for 12 to 20 hours per month of internal effort on platform tuning, typically the support operations lead or RevOps.
KB and content maintenance. The KB-feedback-loop requires ongoing owner work to review candidates, approve updates, and maintain hygiene. Plan for 8 to 16 hours per month of KB owner time on top of any content production effort. Operations that skip this watch auto-resolution rates degrade.
Payback period
For Indian companies handling more than 1,500 tickets per month across customer service, IT helpdesk, or HR helpdesk, typical payback is 5 to 11 months. Variance comes from current baseline metrics (worse starting point means bigger improvement), ticket category mix (more routine-heavy means faster deflection), and KB quality (better KB at start means faster auto-resolution ramp).
Below 500 tickets per month, the orchestration overhead typically exceeds the value. Traditional platform with strong agent training delivers comparable unit economics. Between 500 and 1,500, automation pays off if the routine ticket share is sufficient to make deflection meaningful. Above 1,500, automation is essential for any kind of consistent quality and competitive cost structure.
About the Author

Ankur Singh
Ready to orchestrate your AI future?
Converiqo AI helps you design, deploy, and scale automation workflows that move your business faster, leveraging specialized solutions like our AI bot platform for lead generation, customer self-service AI bot platform, employee self-service AI bot platform, retail omnichannel automation, and our detailed guides on how agentic AI bot platforms work in enterprises and cost structure of enterprise AI bot platforms. Connect with our team to see the platform in action and co-create the next chapter of intelligent operations.
Read More Blogs
Discover more insights and product updates curated by the Converiqo AI team.
Real ROI of Field Force Automation - Beyond the Activity Dashboard
Four metrics that show real field force automation ROI in India - productivity, data reliability, throughput, and field attrition - not just the activity dashboard.

Beat Planning Is the Highest-Leverage Field Force Capability - Here Is Why
Beat planning decides coverage, call frequency, and whether field time is productive. Why it is the single highest-leverage field force automation capability.
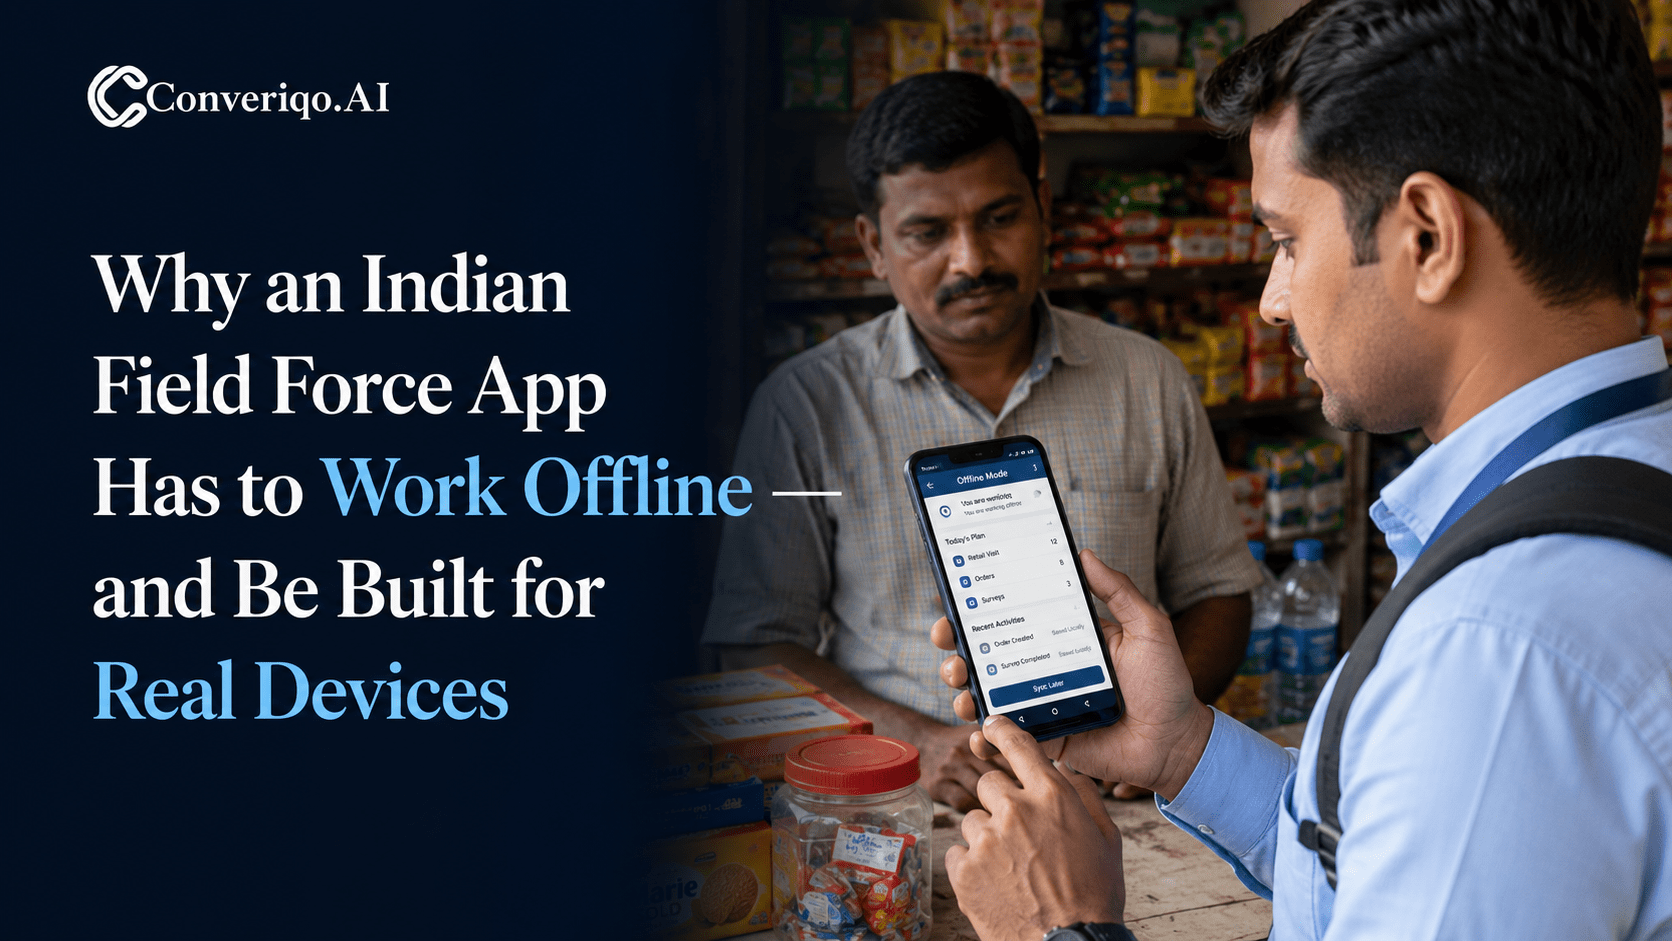
Why an Indian Field Force App Has to Work Offline - and Be Built for Real Devices
Field work in India happens where connectivity is intermittent. A field force app that assumes constant connectivity fails exactly where field work is done.