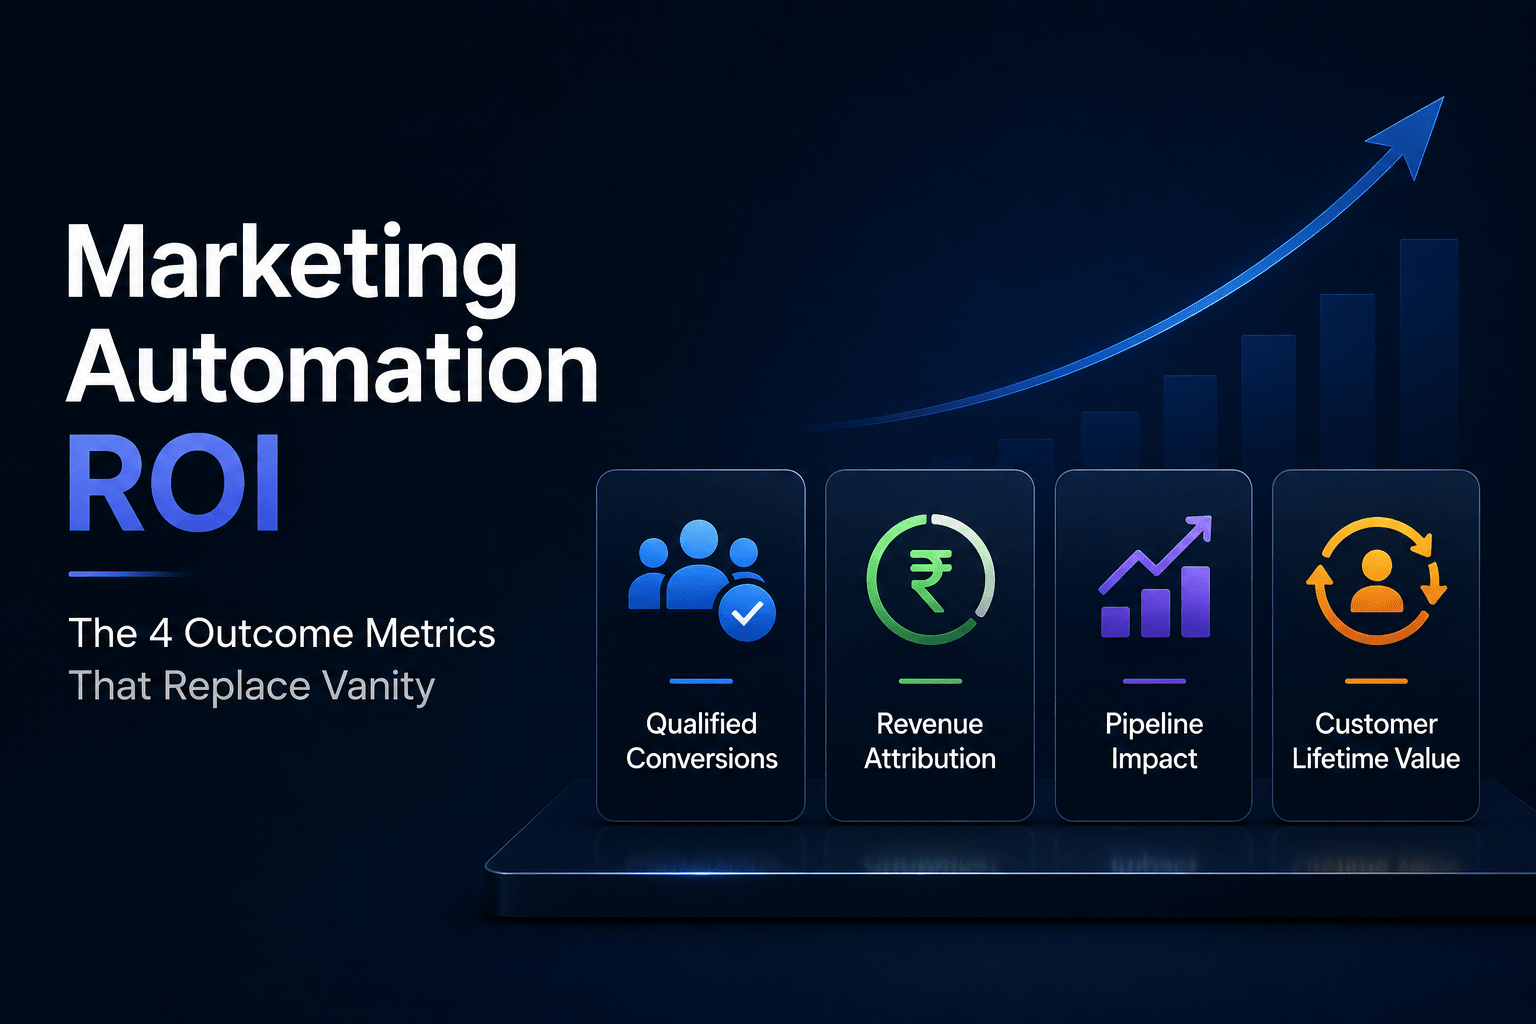
Most Indian marketing dashboards in 2026 still lead with open rate, click-through rate, list size, and reach. These metrics describe activity. They describe whether the marketing happened. They do not describe whether the marketing produced anything.
Marketing automation ROI shows up in different numbers - outcome metrics that tie activity back to business results. Four are worth tracking as primary.
Metric 1 - Marketing-influenced revenue (MIR)
Of the revenue closed in a period, what share had a marketing touch in the relevant attribution window. MIR is the metric that lets marketing answer the founder's question - what does marketing produce.
Calculation. For each closed deal in the reporting period, check whether the customer had any marketing touch - email open, WhatsApp engagement, campaign click, content download - within the attribution window (commonly 90 or 180 days). The share of revenue with at least one marketing touch is the MIR.
Variants. First-touch MIR - share of revenue where the first identified touch was a marketing touch. Last-touch MIR - share where the last touch before close was a marketing touch. Multi-touch MIR - weighted share where marketing touches across the journey contribute fractionally. Each model has flaws. Reporting all three gives sensitivity rather than false precision.
Indian baseline. For Indian SMBs running multi-channel marketing automation against a sales-led close motion, MIR is typically in the range of 40% to 75% under multi-touch attribution. Below 40% suggests marketing is not influencing the pipeline. Above 75% likely overstates marketing's role; the attribution window may be too generous.
Metric 2 - Journey completion rate
Of contacts who entered each journey (welcome, nurture, re-engagement, cart abandonment, festival), what share reached the desired outcome (qualified, converted, recovered, retained).
Why it matters. Journey completion rate measures whether the journey design is working. Low completion rate means the journey is losing people somewhere in its flow. Specific stages of drop-off reveal where the design needs work - a content match issue, a channel mismatch, a frequency problem, a CTA weakness.
Indian baseline. Welcome journeys typically run at 30% to 60% completion. Nurture journeys at 10% to 30%. Re-engagement journeys at 5% to 15%. Cart abandonment at 10% to 25% recovery. These are wide ranges; what matters is whether the rate is improving with optimisation work, not the absolute number.
Metric 3 - Unsubscribe-to-engagement ratio
The ratio of opt-outs to meaningful engagement (replies, conversions, shares) for each campaign and across the program overall.
Why it matters. A high unsubscribe rate against low engagement signals that the campaign is hitting the wrong audience with the wrong content, or hitting too often. Engagement without unsubscribes is healthy. Unsubscribes without engagement is unsustainable - the list is being burned for short-term volume.
Indian baseline. Healthy programs run at 1 unsubscribe per 100 meaningful engagements or lower. Programs with 1 unsubscribe per 10 engagements are damaging the database. Programs that look at unsubscribes only as an absolute number miss the ratio that matters.
Metric 4 - Cost per engaged contact (CPEC)
Total marketing automation cost - platform fees, content production, ops team time - divided by the count of contacts who engaged meaningfully in the reporting period.
Why it matters. CPEC is the unit economics number for marketing automation. Lower CPEC over time means the orchestration is improving - the same investment is producing more meaningful engagement. Flat CPEC means the spend is buying activity, not engagement.
Indian baseline. Highly variable by industry and database size. What matters is the trajectory. CPEC should improve quarter over quarter as the journey library matures and the database hygiene improves. If CPEC is flat or rising despite more campaigns, the orchestration is failing.
Hidden costs the vendors do not mention
Three.
Content production. Marketing automation needs content to orchestrate. Indian platforms quote license costs but skip the content production engine that the orchestration consumes. A working program typically needs 3 to 5 net new pieces of content per week - emails, WhatsApp templates, landing pages, social posts, ads. The production cost is real, recurring, and often larger than the platform license.
Database hygiene effort. Indian marketing databases require ongoing cleanup. Bounces, duplicates, stale records, mismatched fields. A working program spends 8 to 16 hours per month on database hygiene. Without it, the orchestration's personalization misfires.
Cross-channel costs that scale. WhatsApp conversation pricing scales with volume. SMS costs scale. Email deliverability tools scale. The license fee is rarely the whole picture. TCO for 24 months including channel costs at projected scale is the right framing.
Payback period
For Indian SMBs running multi-channel campaigns with database sizes above 25,000 contacts, typical payback for full marketing automation deployment is 6 to 12 months. Variance comes from current baseline MIR (lower baseline means bigger improvement), database quality (worse baseline means more cleanup before automation produces), and the strength of the existing content engine (no content means automation has nothing to orchestrate).
Smaller databases - under 5,000 contacts - typically do not justify full deployment. Manual operation with discipline delivers comparable personalization at lower cost. Between 5,000 and 25,000, payback exists if there is an active content engine. Above 25,000, automation becomes essential for any kind of personalized engagement.
About the Author

Yash Soni
Ready to orchestrate your AI future?
Converiqo AI helps you design, deploy, and scale automation workflows that move your business faster, leveraging specialized solutions like our AI bot platform for lead generation, customer self-service AI bot platform, employee self-service AI bot platform, retail omnichannel automation, and our detailed guides on how agentic AI bot platforms work in enterprises and cost structure of enterprise AI bot platforms. Connect with our team to see the platform in action and co-create the next chapter of intelligent operations.
Read More Blogs
Discover more insights and product updates curated by the Converiqo AI team.

Real ROI of Field Force Automation - Beyond the Activity Dashboard
Four metrics that show real field force automation ROI in India - productivity, data reliability, throughput, and field attrition - not just the activity dashboard.

Beat Planning Is the Highest-Leverage Field Force Capability - Here Is Why
Beat planning decides coverage, call frequency, and whether field time is productive. Why it is the single highest-leverage field force automation capability.
Why an Indian Field Force App Has to Work Offline - and Be Built for Real Devices
Field work in India happens where connectivity is intermittent. A field force app that assumes constant connectivity fails exactly where field work is done.